Your super intelligent money companion
Use AI to visualize your spending, plan your investments, and customize the app to fit your financial strategy.
New accounts start with a 33-day free trial.
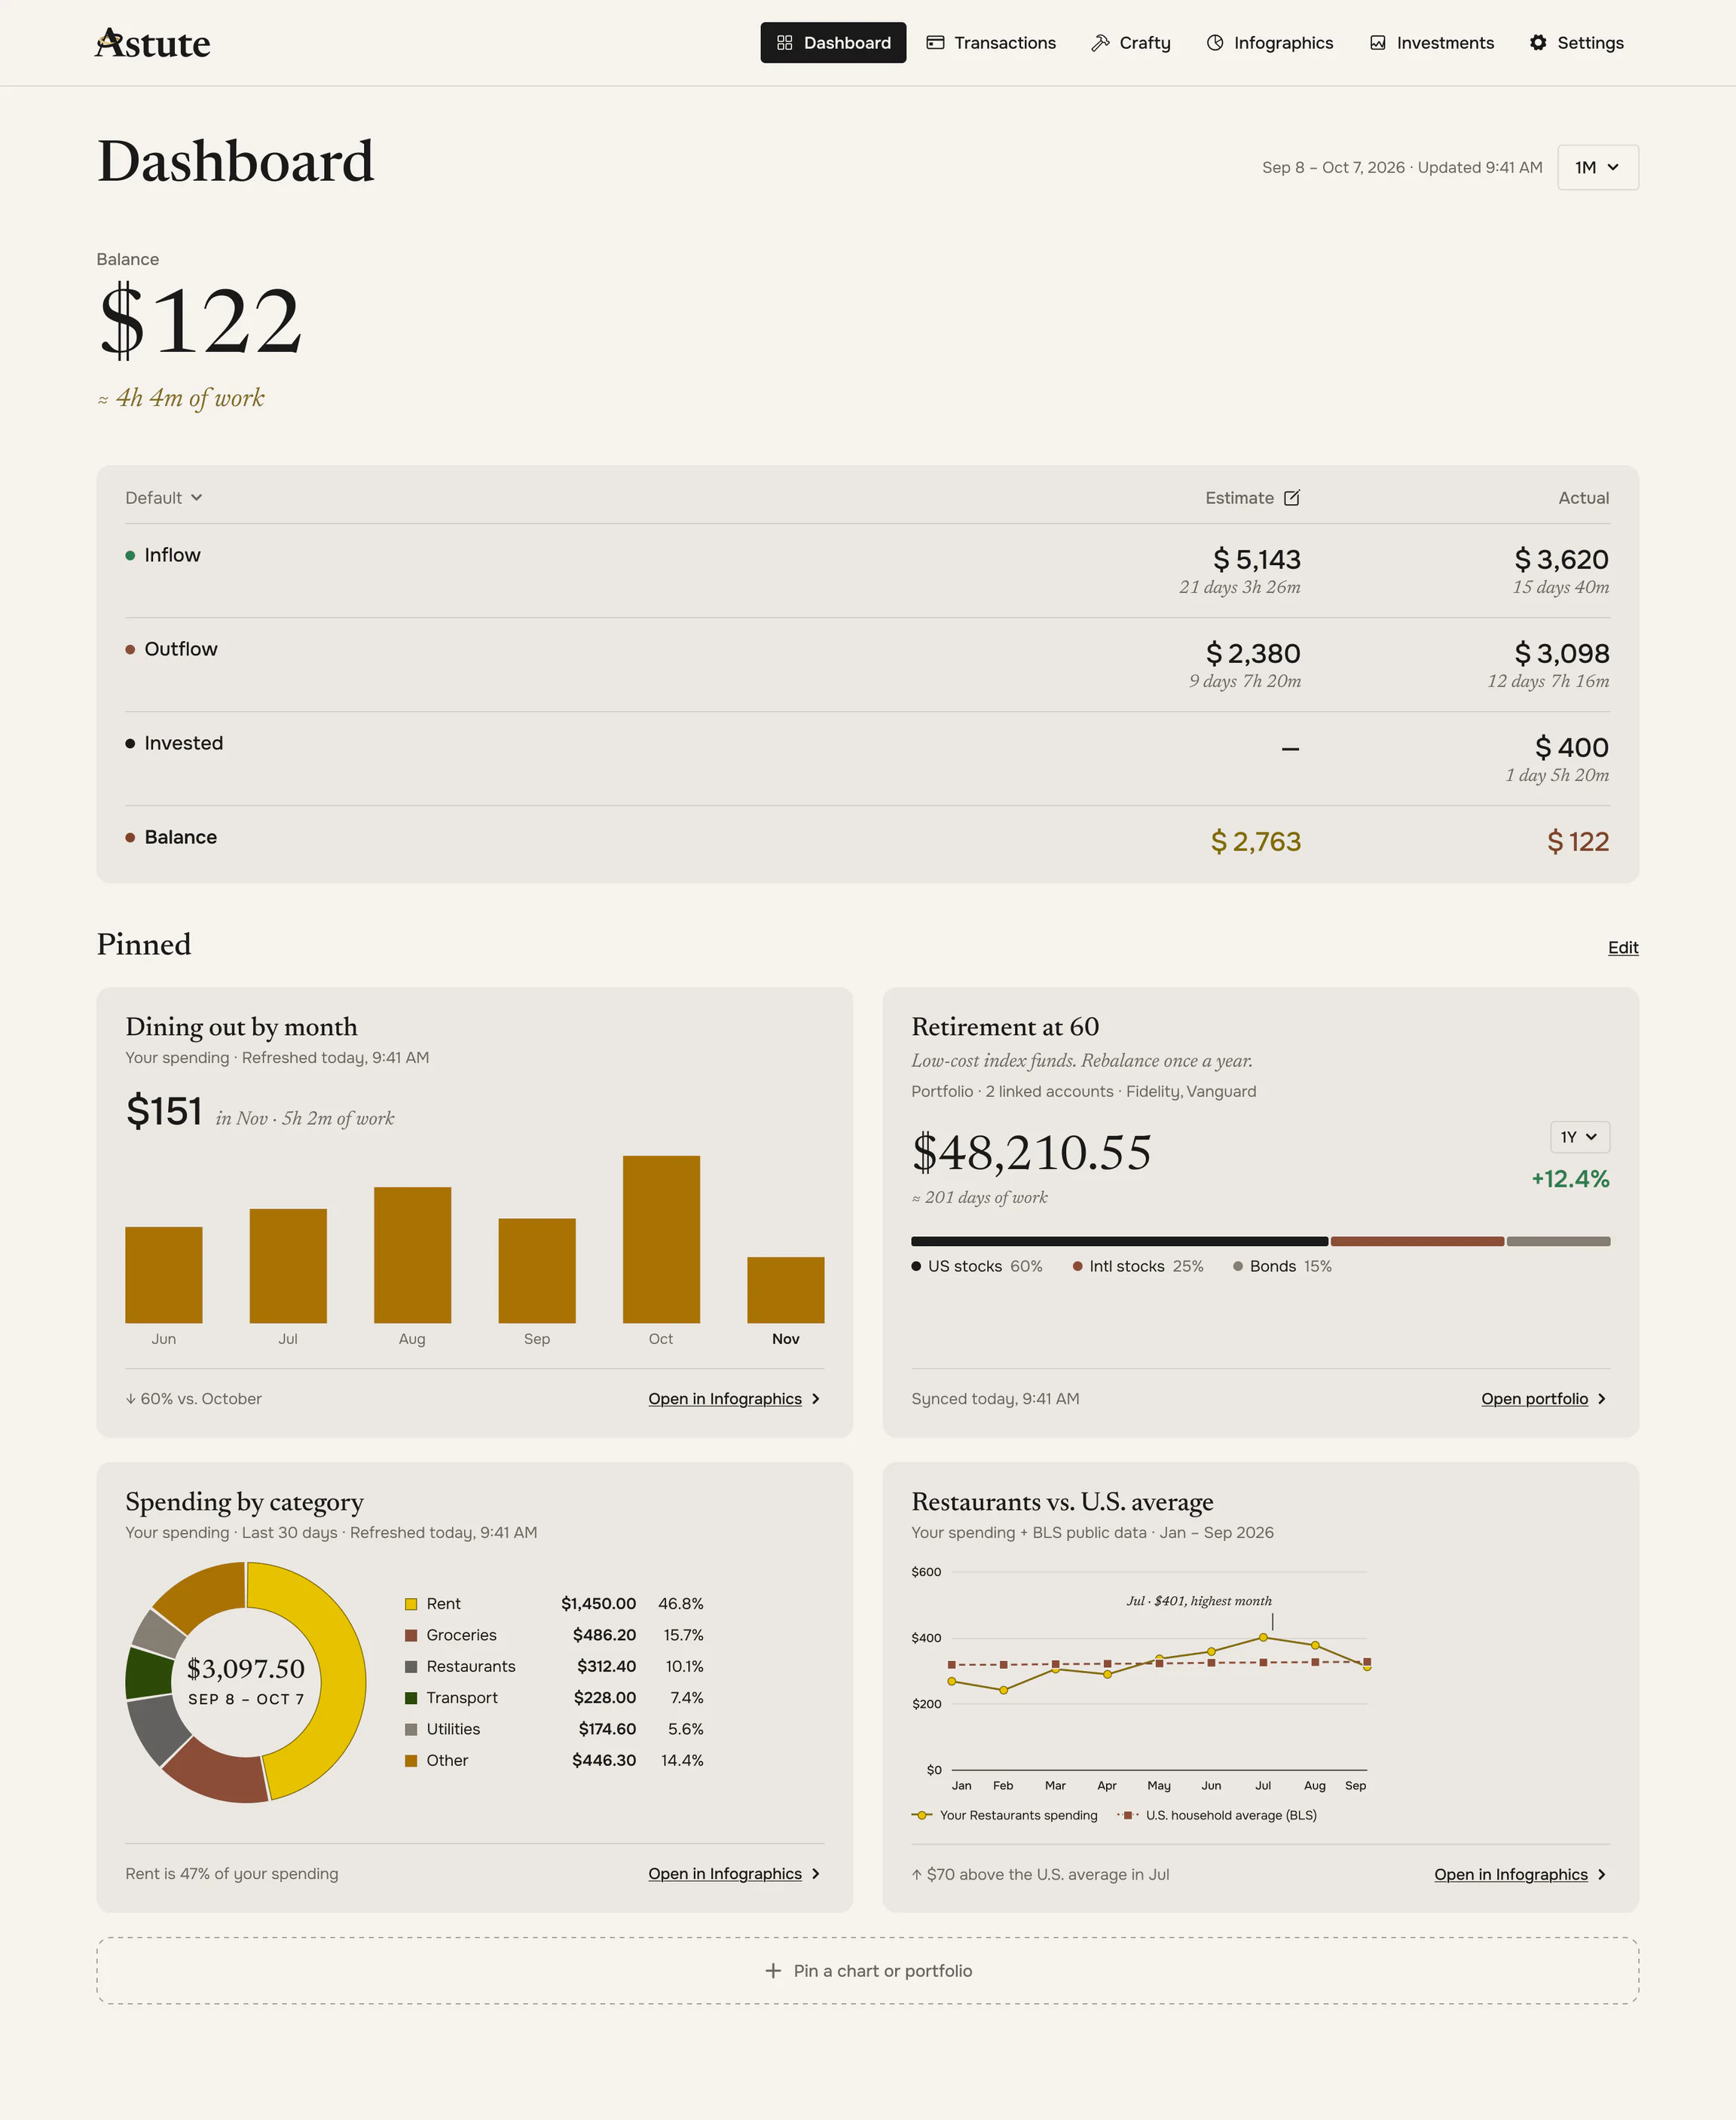
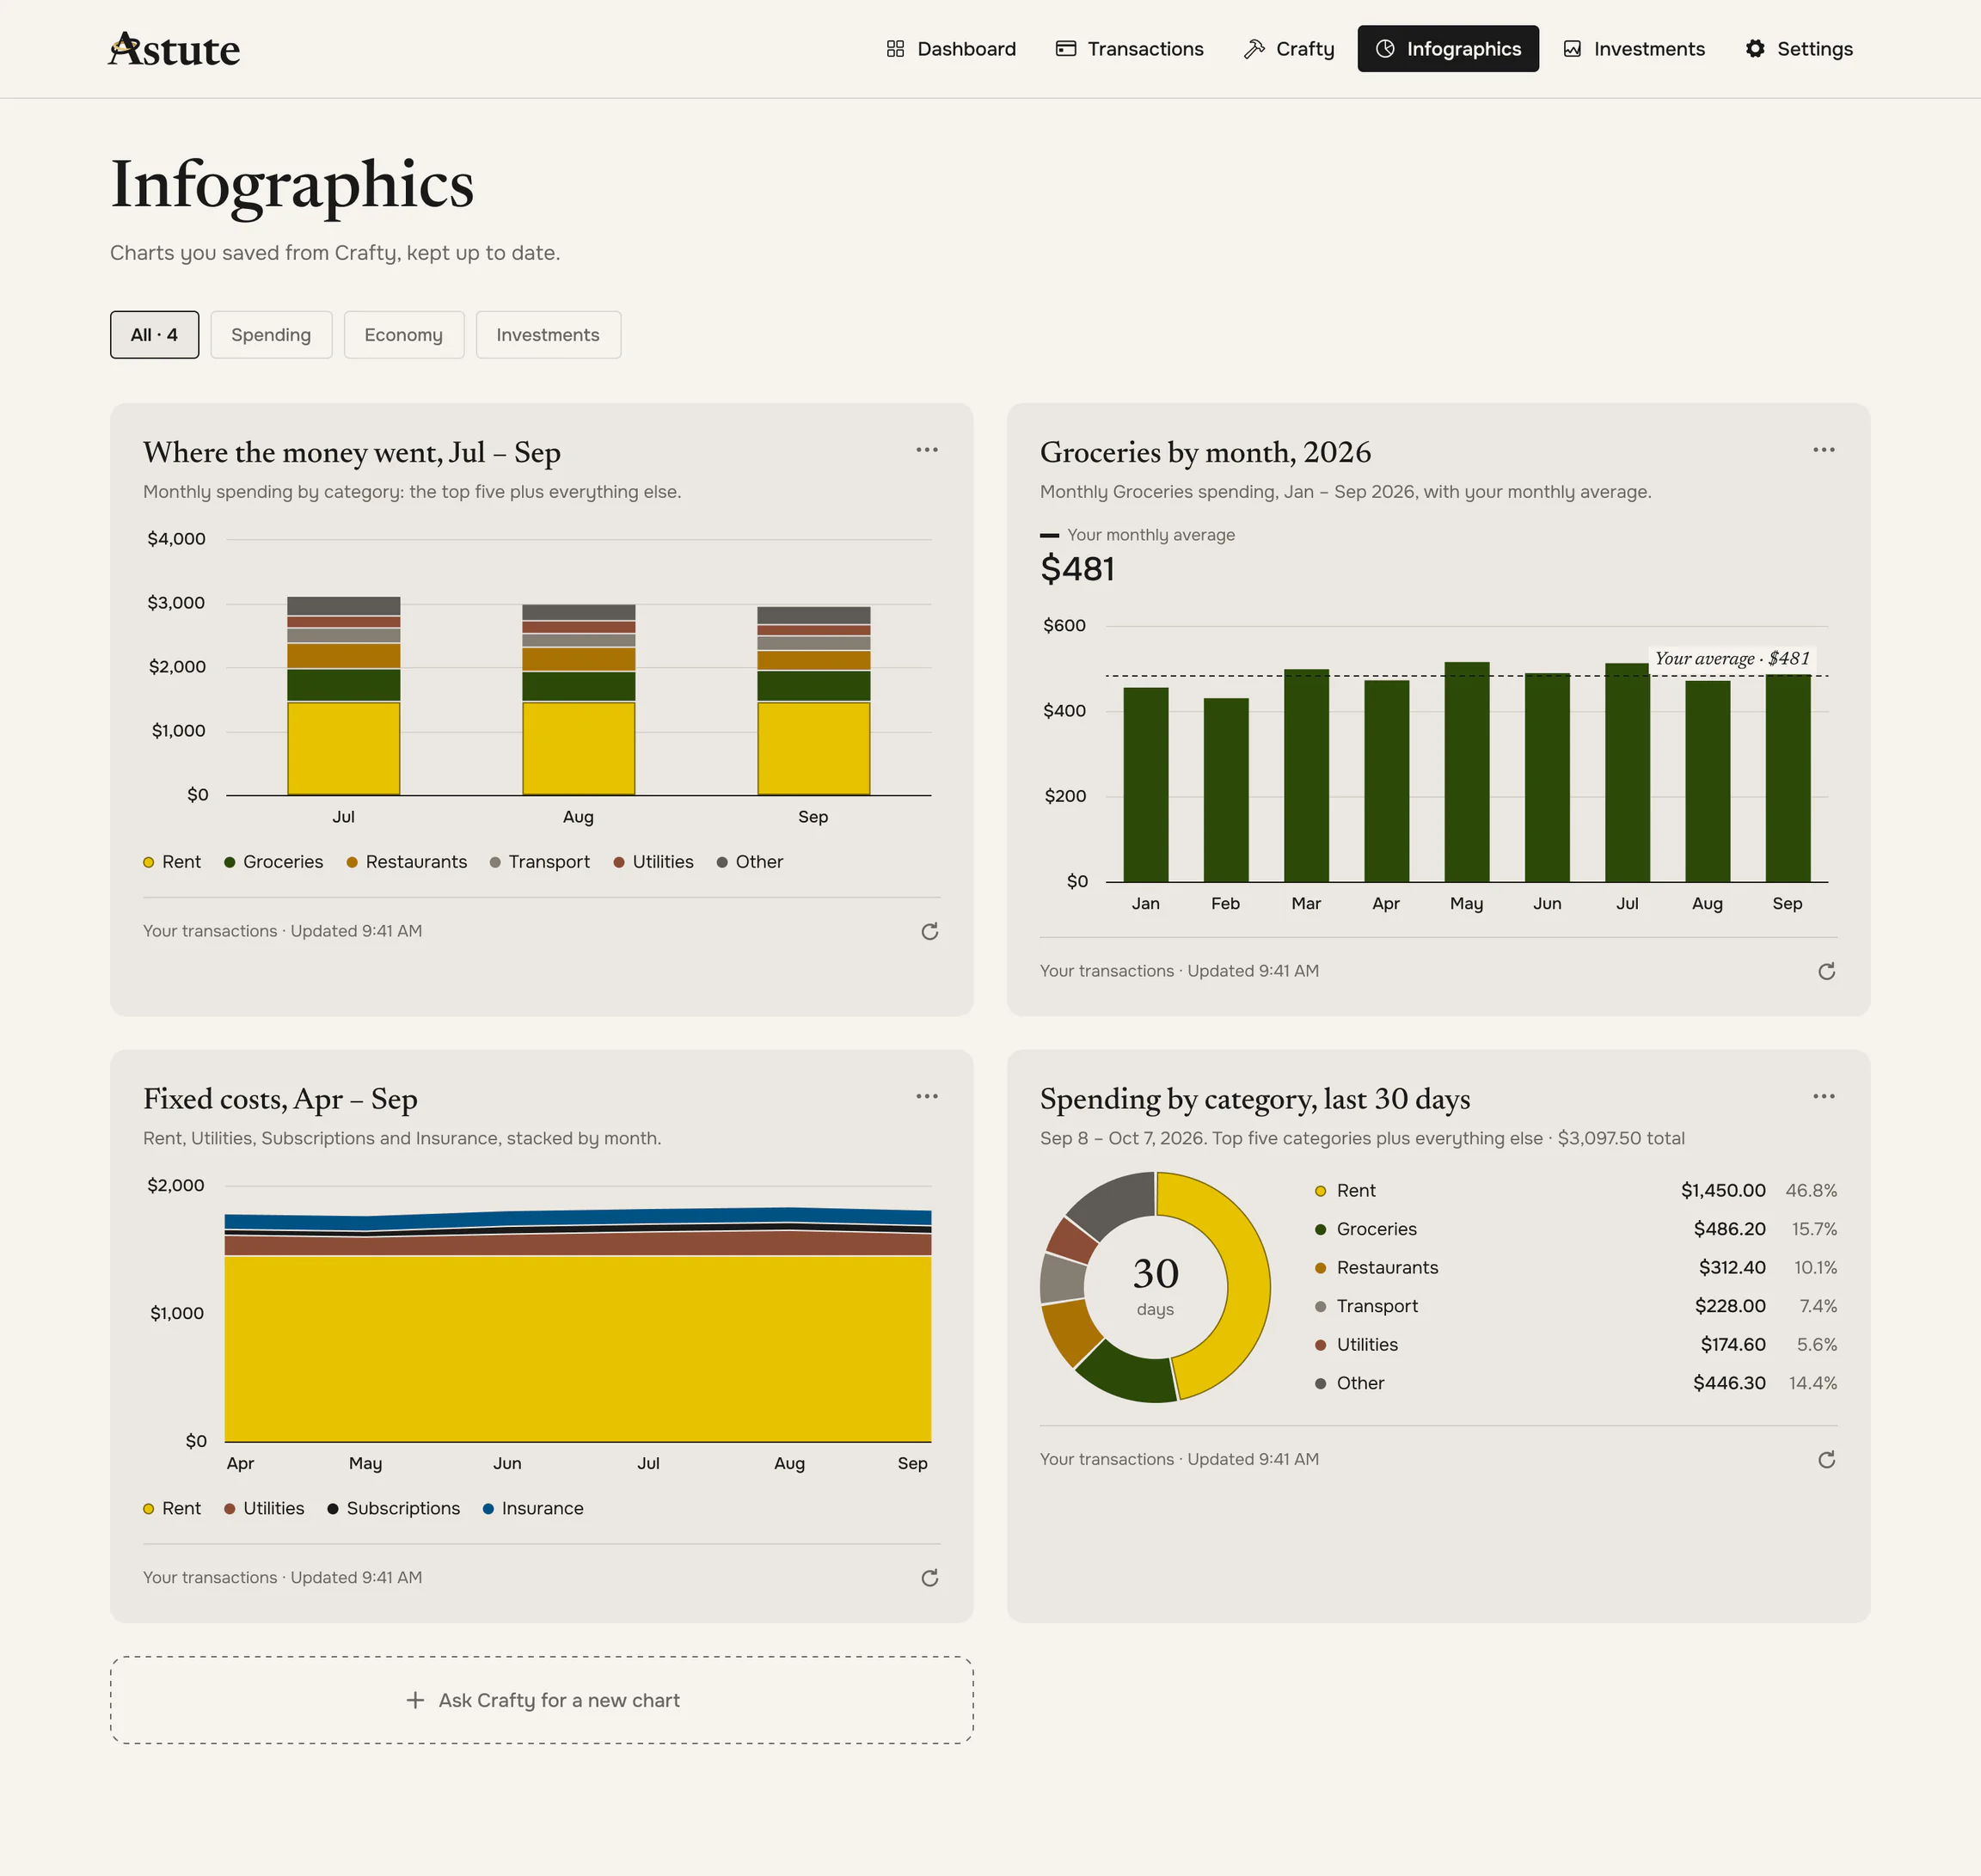
Top 3
- Rent
- $1,450.00 · 46.8%
- Groceries
- $486.20 · 15.7%
- Restaurants
- $312.40 · 10.1%
Last 30 days · $3,097.50 total · Your transactions
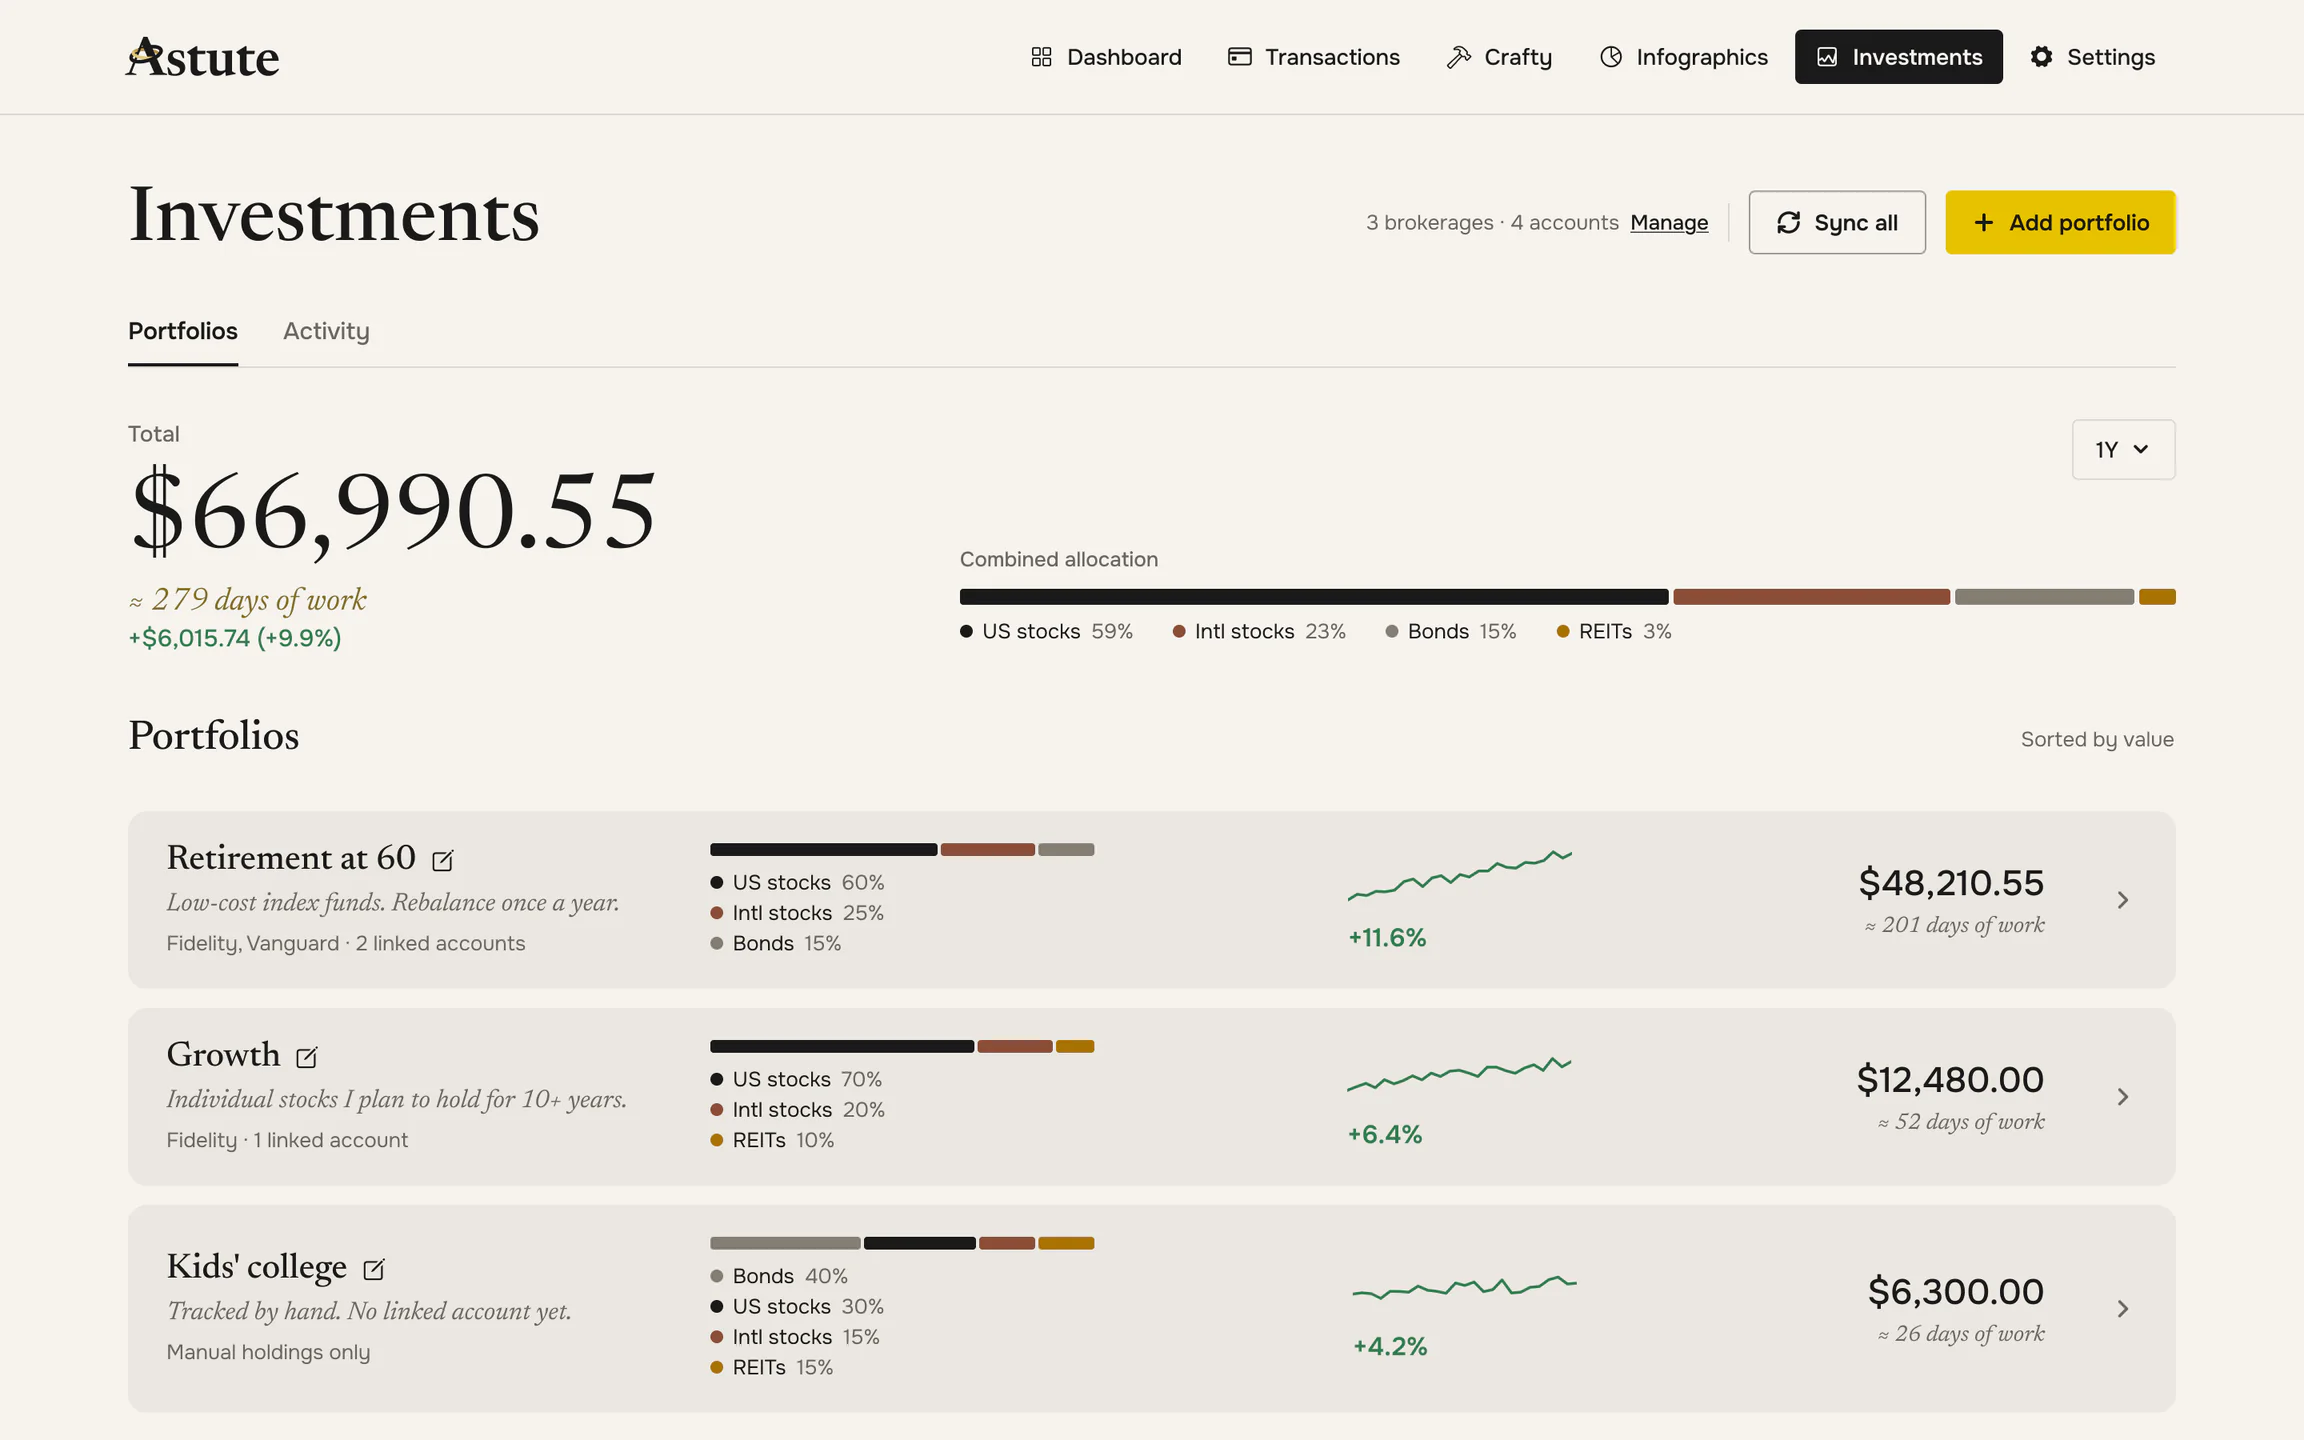
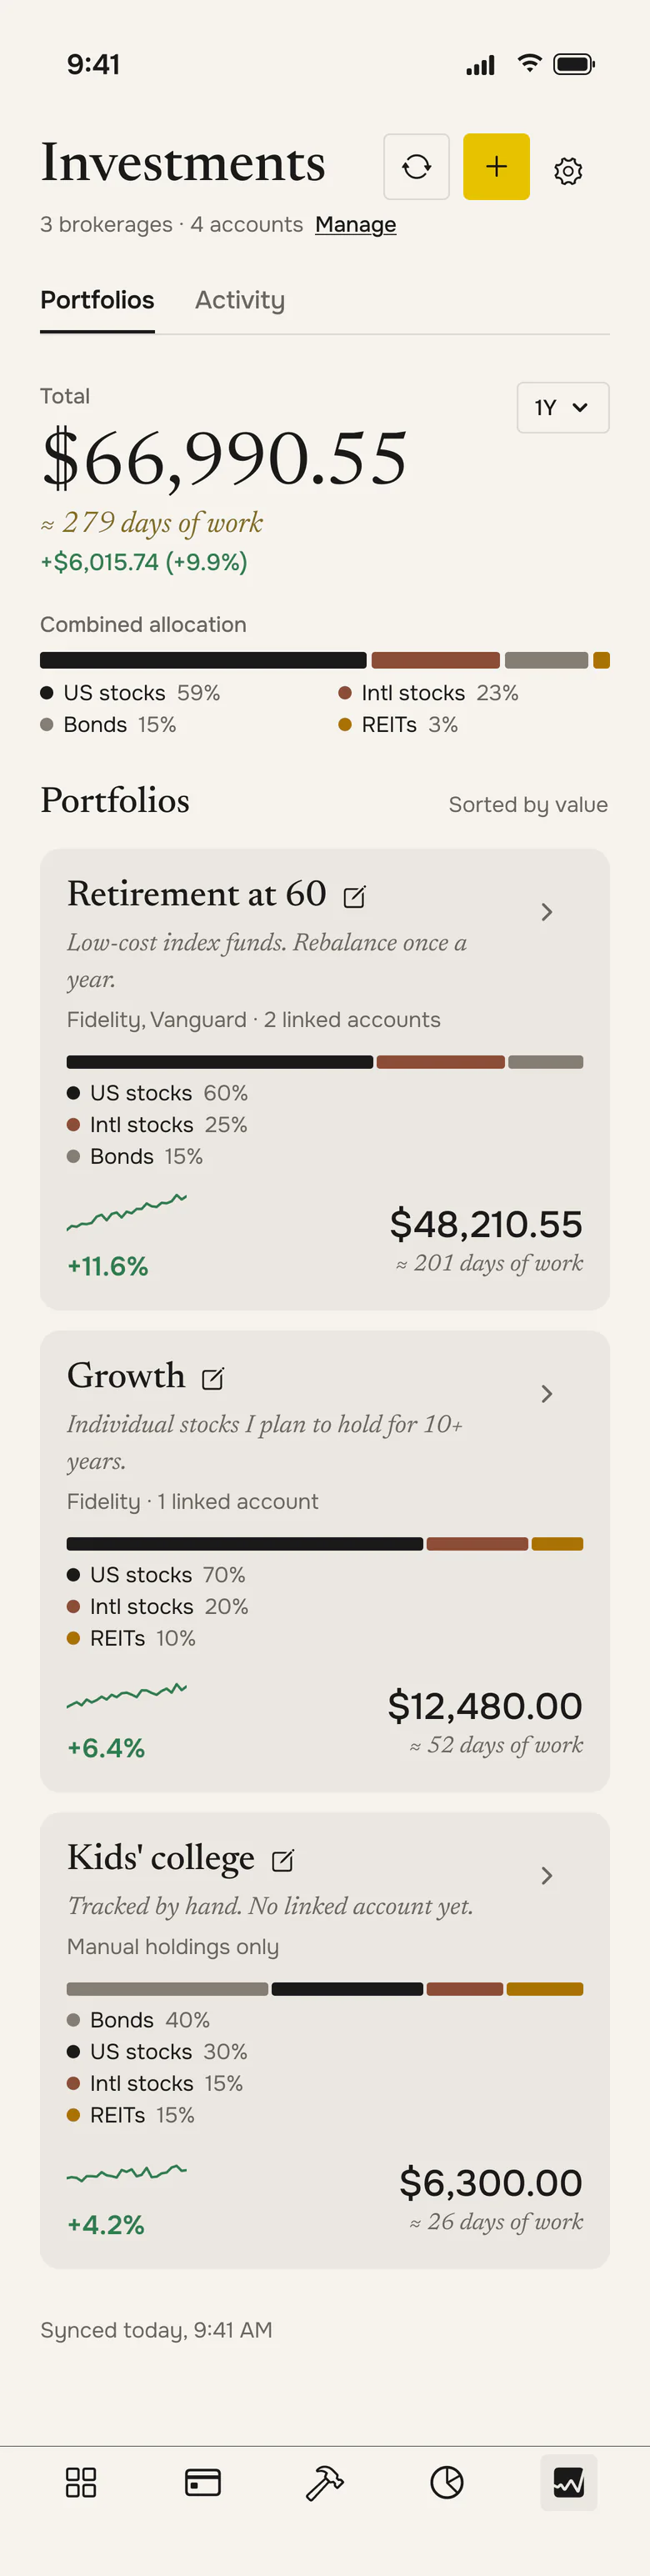
- Retirement at 60
- $66,990.00
- 1Y
- +9.9%
- In your time
- ≈ 279 days of work
Portfolio · 2 linked accounts · Synced 9:41 AM
- VTIU.S. stocks
- 59%
- VXUSInternational
- 23%
- BNDBonds
- 15%
- VNQReal estate
- 3%
Sample portfolio from Crafty · Save it to Investments
Stacked by month, Apr – Sep totals
- Rent
- $8,700
- Utilities
- $1,045
- Insurance
- $708
Your transactions · Updated 9:41 AM
Your Restaurants spending vs. U.S. household average, Jan – Sep 2026
- You, Jul
- $401
- U.S. average, Jul
- $327
- Jul
- $74 above the U.S. average
Your spending · BLS public data
Median household income, 2018 – 2023, ACS 1-year
- 2018
- $63,200
- 2023
- $78,000
- 2020
- No ACS 1-year release
Public data · U.S. Census Bureau